Weather News Archive 2019 November
Image 1: 850 temperatures across Australia on Monday 2nd December, 2019. Source: Pivotal Weather
On Sunday 17th November 2019, a significant thunderstorm outbreak occurred across South East QLD. Unofficial hail to the size of softballs (10cm diameter) were reported across parts of the Sunshine Coast, with hail larger than golf balls reported across parts of Logan and the northern Gold Coast.
So, let's have a look back at this day, and how it all unfolded.
Firstly, this day should have come as no shock to people, as thunderstorms, including the potential for severe thunderstorms were forecast days in advance by numerous agencies.
A surface trough was draped from the Gulf all way down into northern NSW, taking on a more north to south orientation across SE QLD and NE NSW (this orientation will be important later on). One big uncertainty on this day, would be whether drier west to south-westerly winds may push too close to the coast. Regardless of this, it was evident that thunderstorms were more than likely at least across the Sunshine Coast region.
The morning started off sunny with temperatures quickly warming up. The 18z analysis showed a nice tongue of 700-800mb moisture from the southern Wide Bay through to north of Brisbane. This was likely to be the trigger for more elevated/high based convection during the early afternoon hours across parts of the Brisbane Valley. 18z ACCESS C 1hr precipitation was on the money for this event across this region, blowing up activity at around lunchtime.
Image 1: ACCESS C 1hr precipitation field 12pm. WeatherWatch
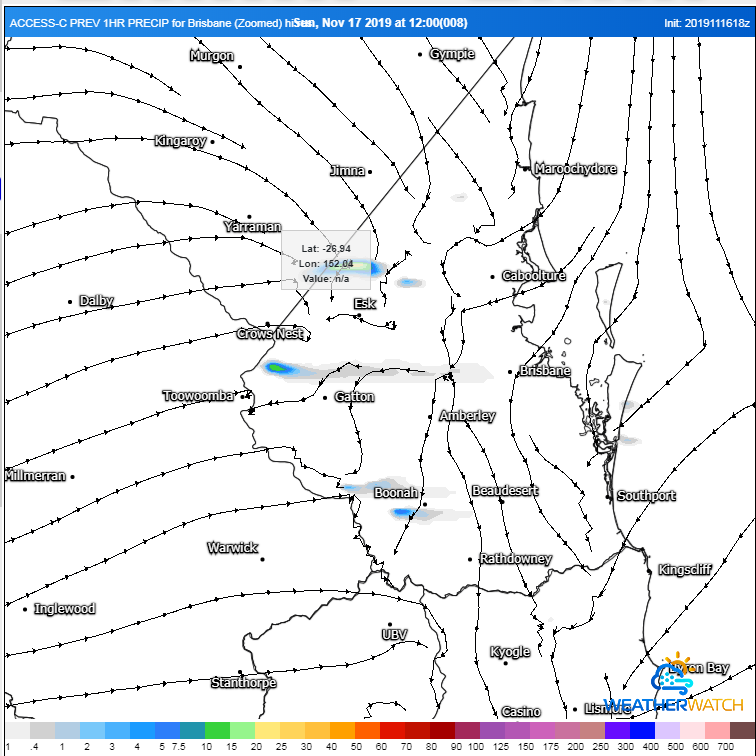
Image 2: ACCESS C Esk Sounding 1pm EST WeatherWatch
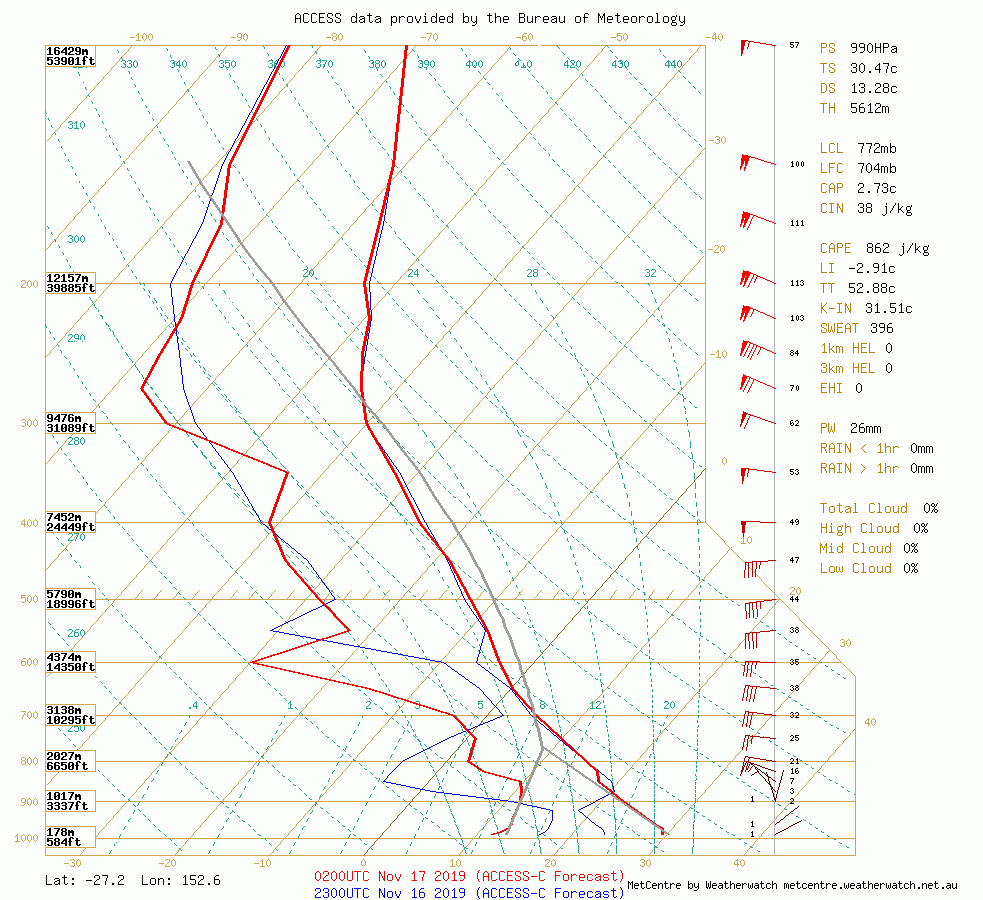
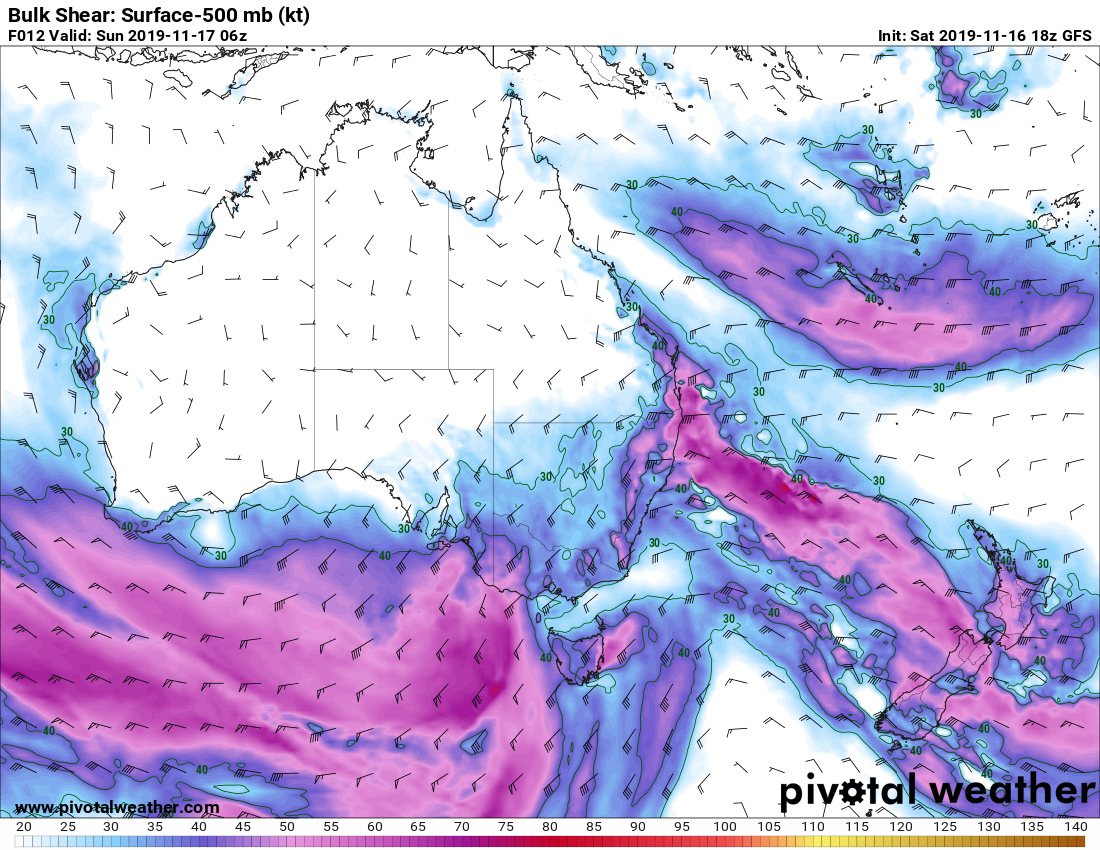
It was evident during the morning that an impressive kinematic and thermodynamic profile existed across SE QLD with bulk shear profiles in the 40-45kts range & ML CAPE (Convective Available Potential Energy) across coastal regions was in the order of 2000-3000 joules, with a strong north-easterly feed developing during the afternoon hours. A strong short wave trough would enter SE QLD with a relative vorticity max sitting across the region. This vorticity max would produce a region of PVA (Positive Vorticity Advection) which would contribute to upper level divergence in the PVA, thus rising air. Of note, the axis of this short wave trough was also perpendicular to the surface trough across SE QLD. 18Z ACCESS C soundings showed surface to 2km lapse rates at impressive values, sitting around the 9.5C/km (dry adiabatic is 9.8C/km), and the 0-6km lapse rate around 7.0C/km across SE QLD during the afternoon hours (see images below).
Image 3: Images via Alicia M Bentley
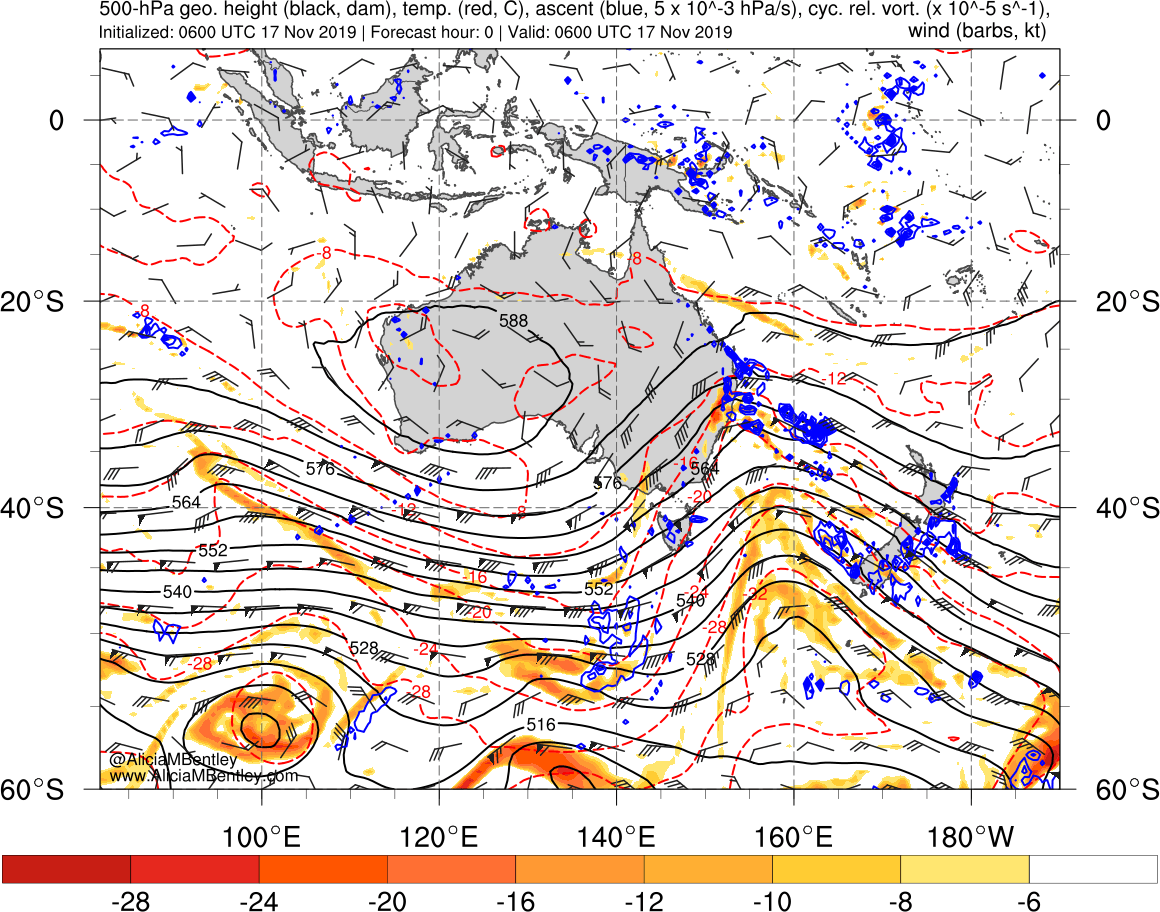 Image 4: Images via Alicia M Bentley
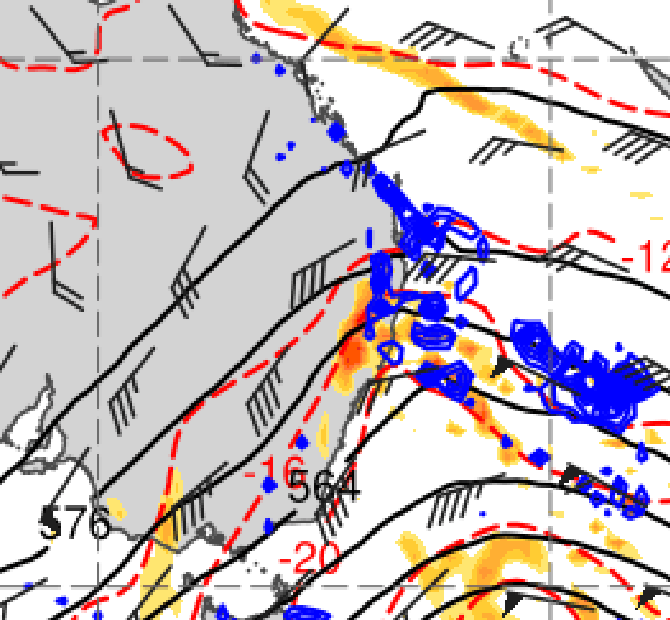 Image 5: GFS Surface streamlines and CAPE
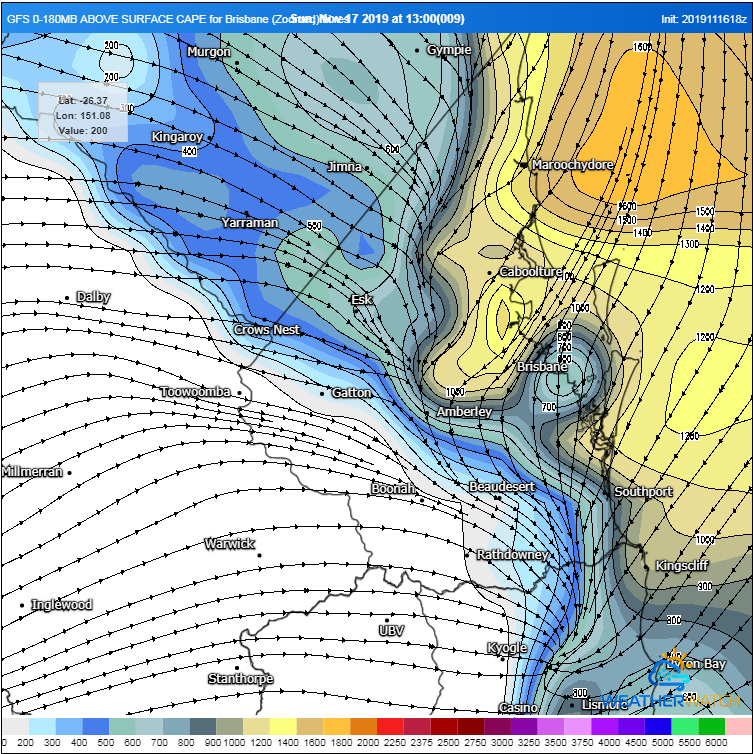 Image 6: 500MB, WeatherWatch MetCentre
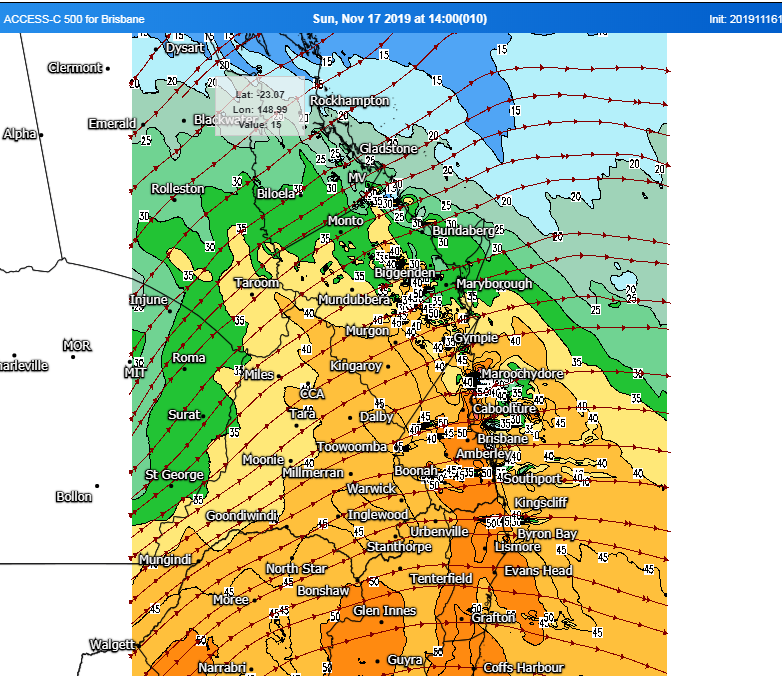 Image 7: Bulk Shear, Pivotal Weather
 18z GFS analysis also showed that drier westerly winds would push very close to the SE Coast from Brisbane to the NSW border, inhibiting the amount of convection that might develop across this region, however forecast soundings via ACCESS C were still very impressive and showcased the potential for supercells should activity fire in this corridor. One potential issue was CIN (Convective Inhabition or a cap) across coastal regions. However, the lift from the shortwave aided in breaching this cap, enabling storm activity to tap into the quality moisture and instability across coastal locations, enabling thunderstorms to rapidly intensify and become supercellular.
Image 8: Brisbane sounding, Sunday morning BoM
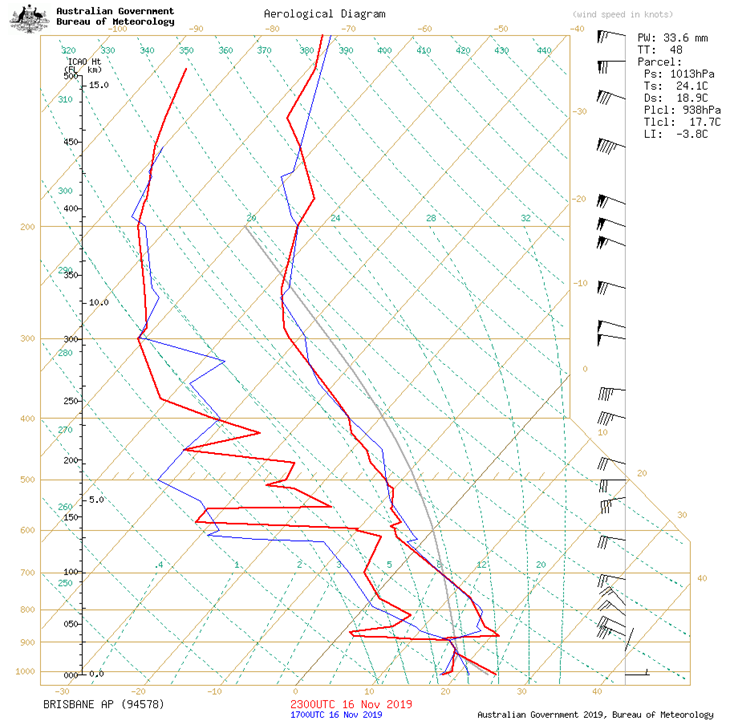
Image 9: ACCESS C sounding, Sunday afternoon (Brisbane to Sunshine Coast). WeatherWatch
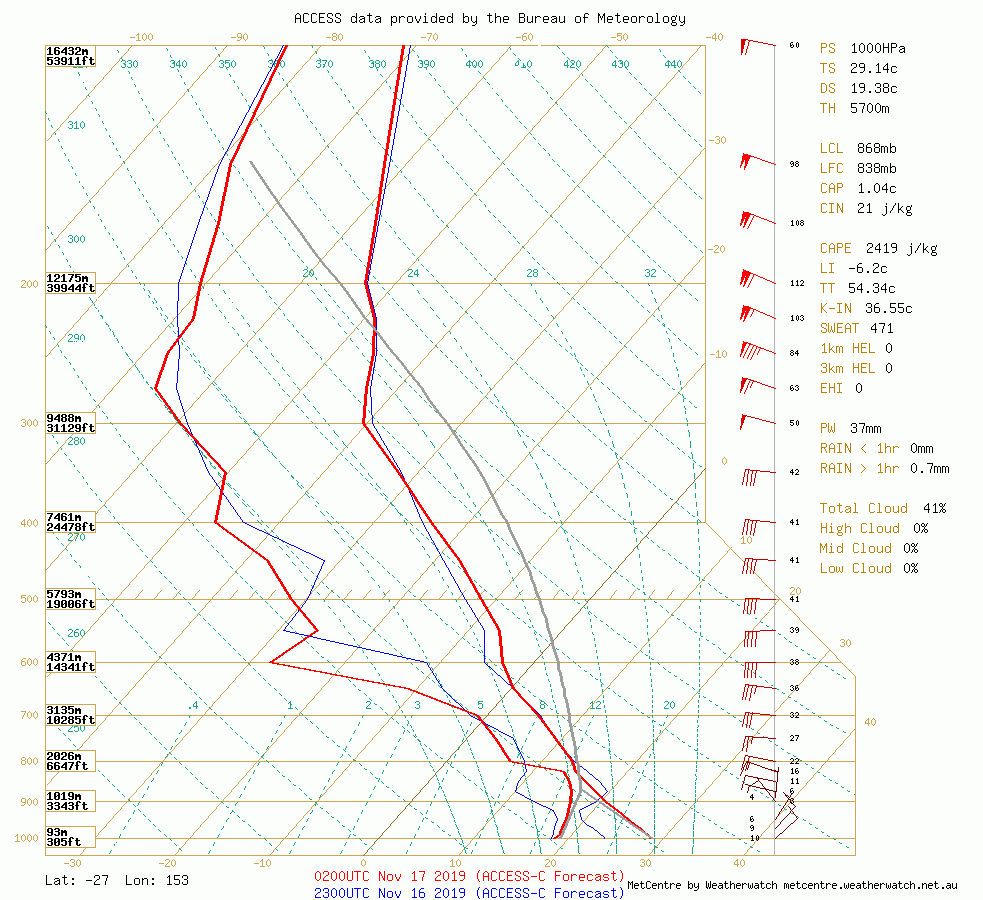 Image 10: Sunshine Coast sounding. WeatherWatch
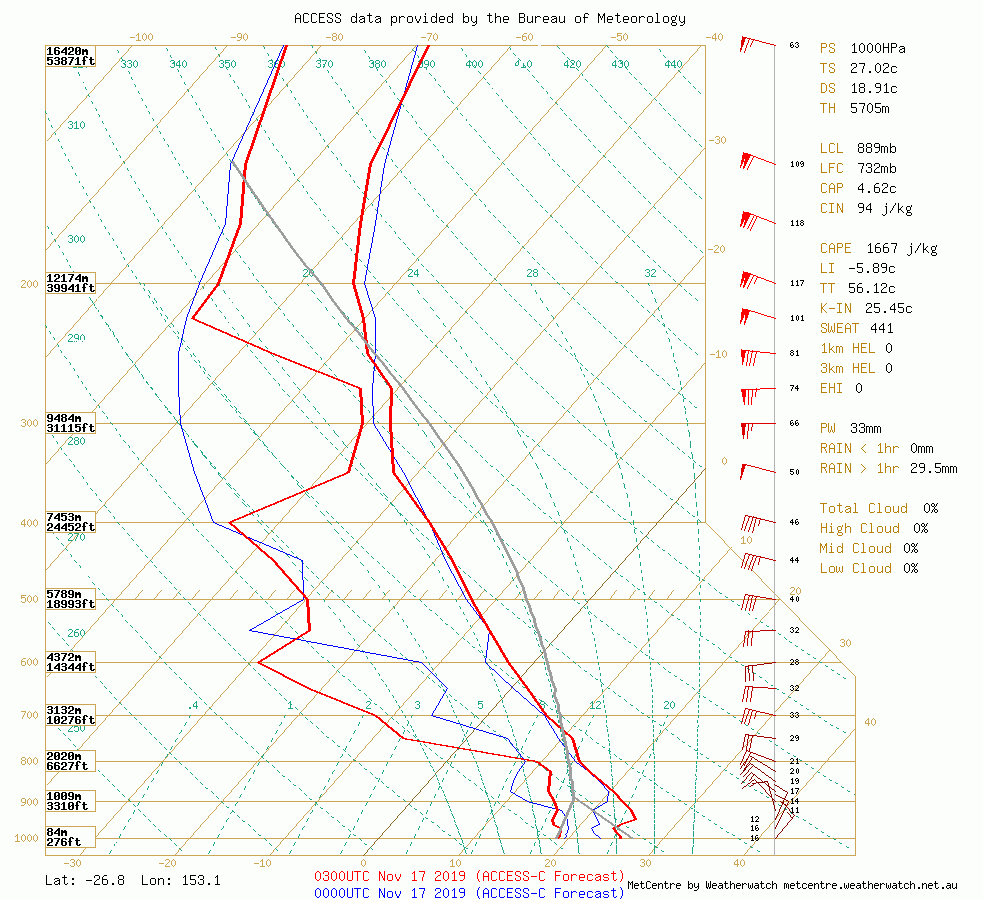 Image 11: Sunshine Coast sounding. WeatherWatch WeatherWatch
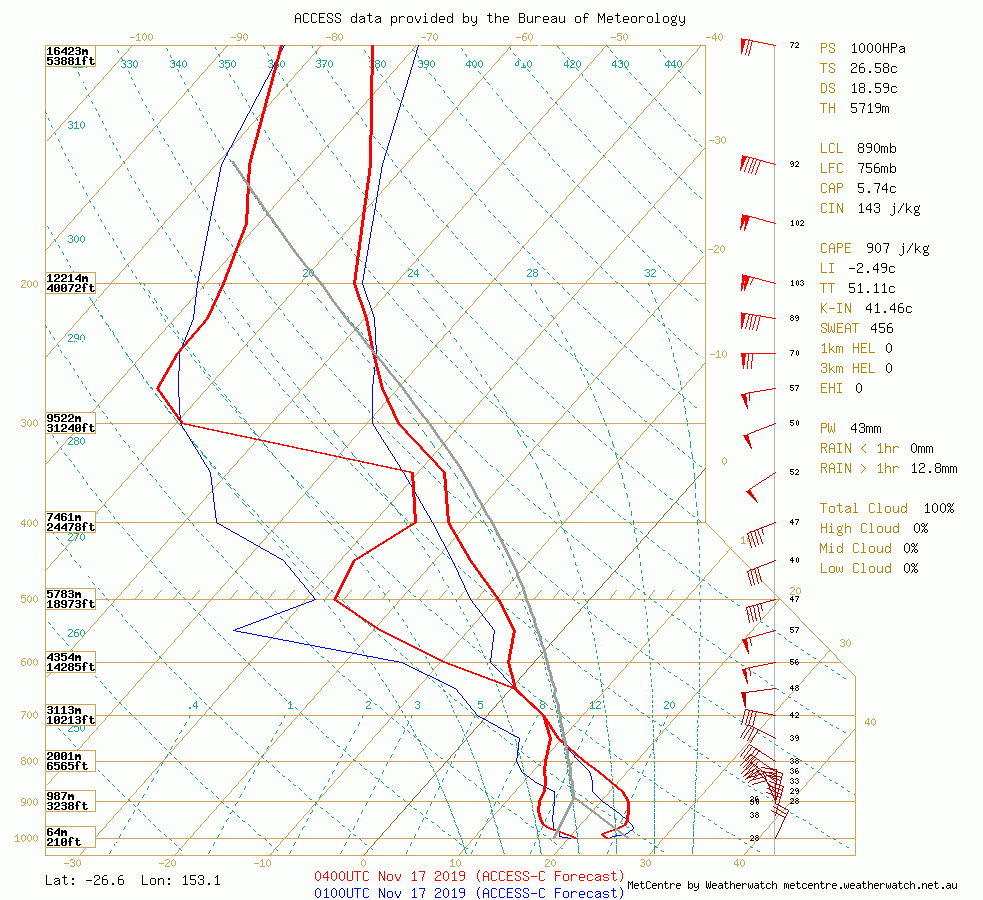 Image 12: Sunshine Coast AP observation, Sunday 17/11/2019h
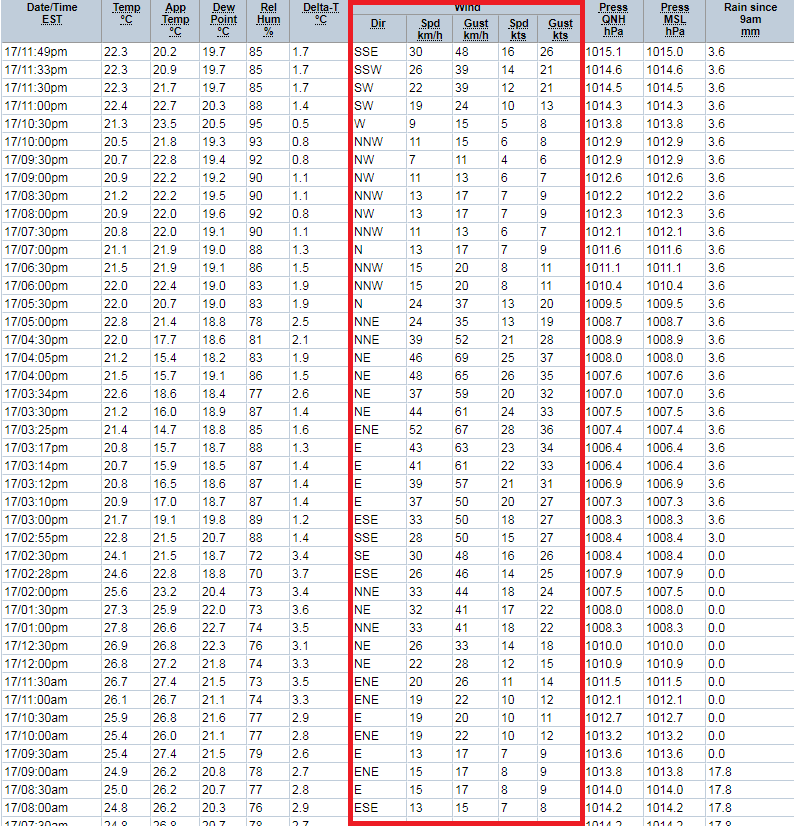 Image 13: Tewantin Observation, Sunday 17/11/2019
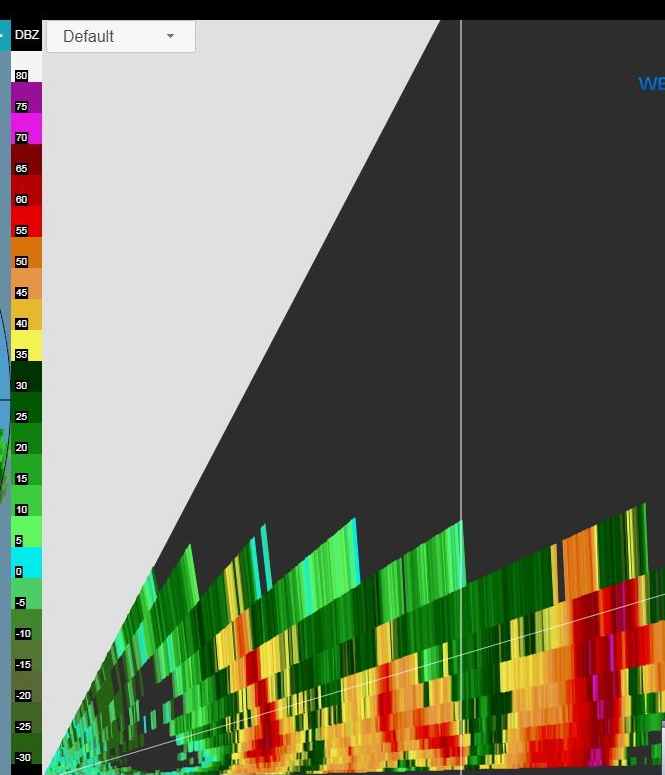
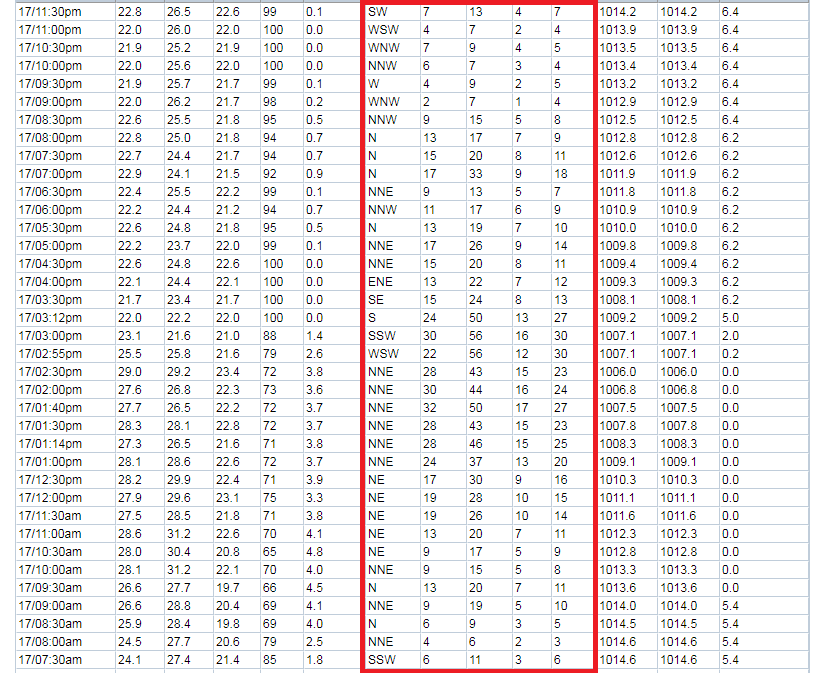 As the storm across the Sunshine Coast began to intensify, it took on classic supercell characteristics. A large hook echo began to form along with a well defined V notch on radar, the sign of an extremely strong and powerful updraft. It was very evident on 3d radar that this storm was impressive, showing a very clear and well defined BWER (Bounded Weak Echo Region). Very strong inflow was now feeding this supercell, with north to north-easterly winds gusting to 70km/h as seen on the observation images above. A clear and well defined couplet was now evident on radar. It was evident that this storm was capable of destructive winds and giant hail. With such a powerful storm exhibiting these characteristics, tornaodgenesis couldn't be ruled out, however it would only be a slim possibilty considering a marginal LLJ (850mb winds) was present. No considerable damage consistent with tornadic activity was reported/occurred.
Image 14: Images via Radar Scope showing inbound and outbound winds, along with a well-defined hook echo
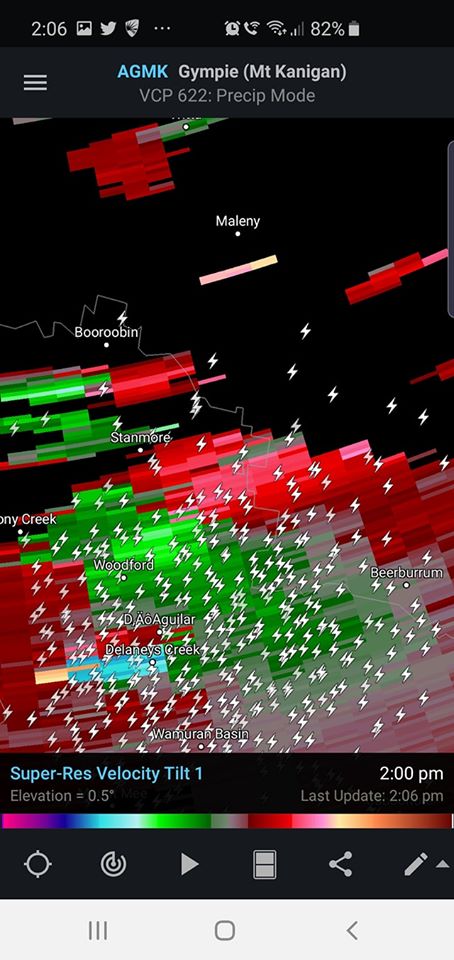 Image 15: Images via Radar Scope showing inbound and outbound winds, along with a well-defined hook echo
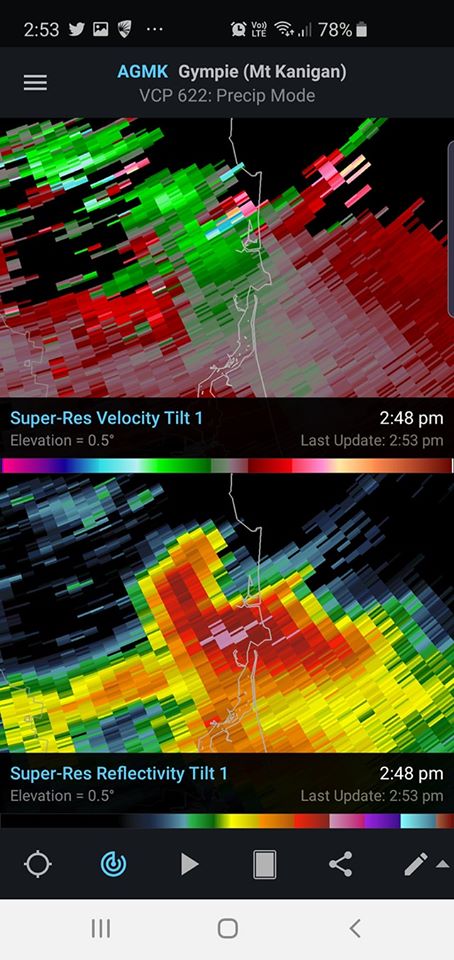 Image 16: Hail to cricket ball size over the Sunshine Coast region
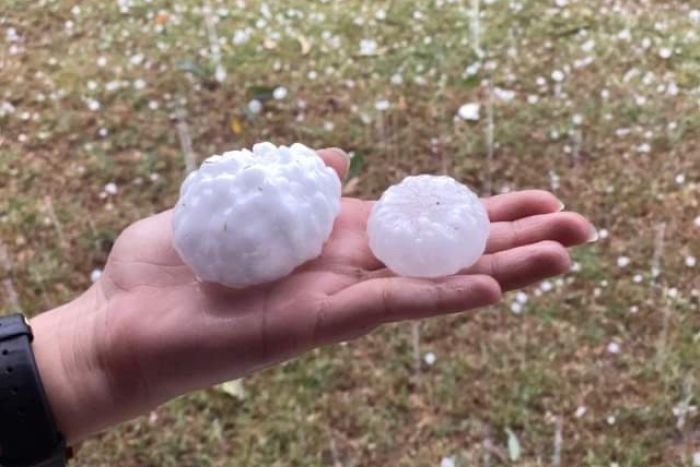 Image 17: A strong couplet begins to develop NW of Caboolture
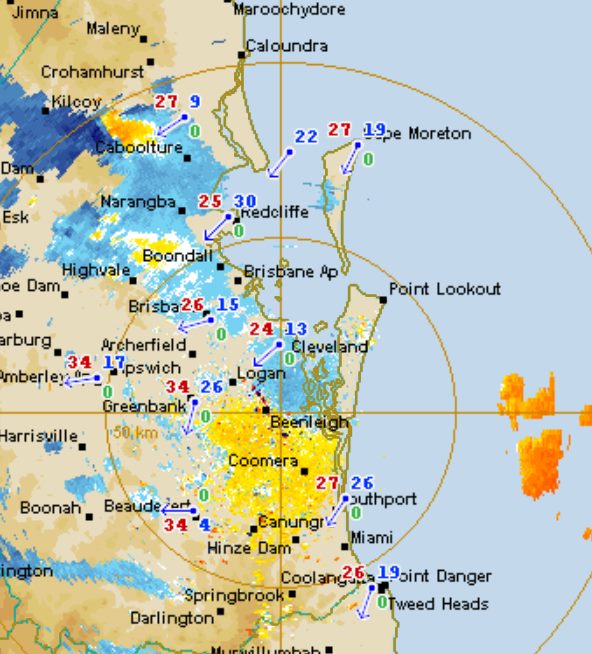 Image 18: Strong inbound and outbound winds near Woodford
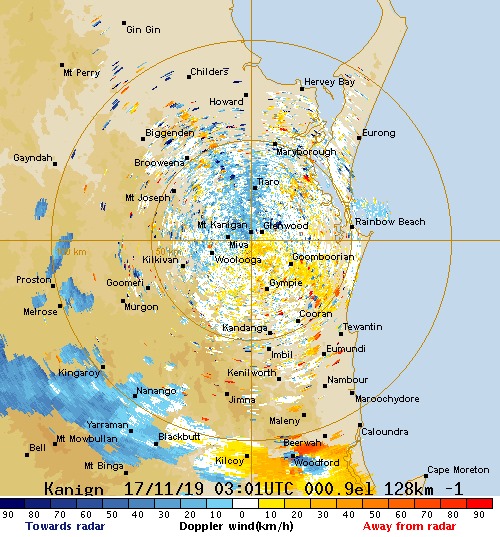 Image 19: A classic V notch appearance takes shape on radar
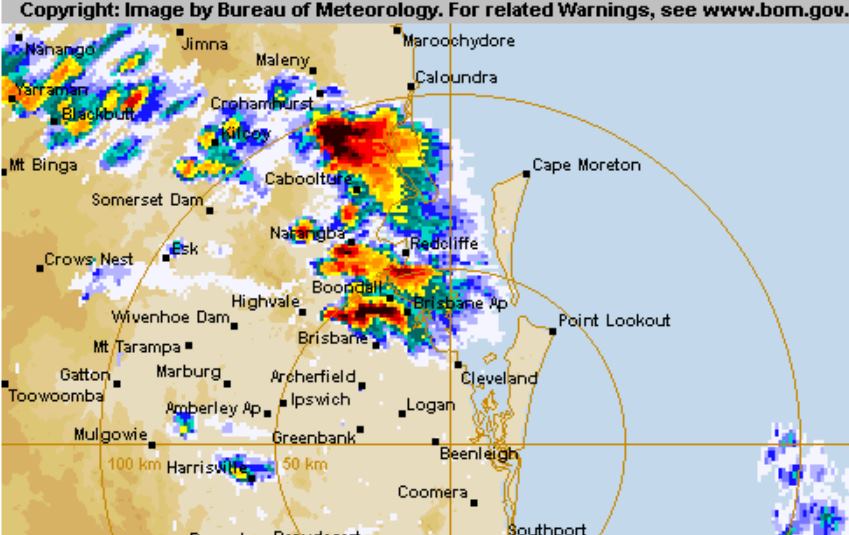 Image 20: Classic BWER signature on 3D radar
 Across the Logan Village-Tamborine-Ormeau-northern Gold Coast regions, splitting supercells developed, with a particularly impressive right moving supercell producing hail between golf ball and cricket ball size. The sounding below was taken from the Tamborine area via ACCESS C. WE can see that this profile exihibits large cape, good shear, moisture depth to nearly 800mb along with streep lapse rates from the surface to 900mb, 800-600mb, along with a pronounced dry slot in the mid levels. Right moving supercells in SE QLD tend to be of the LP (Low precipitation) mode and usually produce large hail. Given the impressive set-up, it was easy to see why a thunderstorm in this environment would rapidly intensify and produce large hail.
Image 21: Sounding from the Tamborine region, Sunday afternoon 17/11/2019
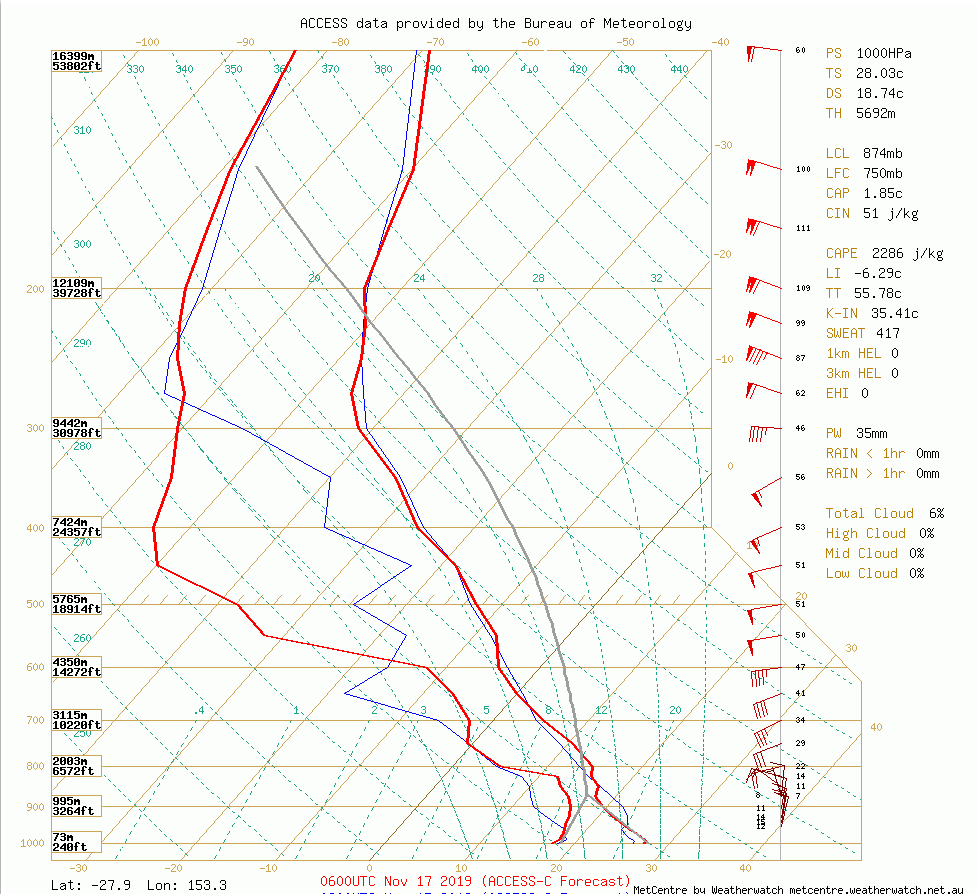 Image 22: Golf ball sized hail from Tamborine
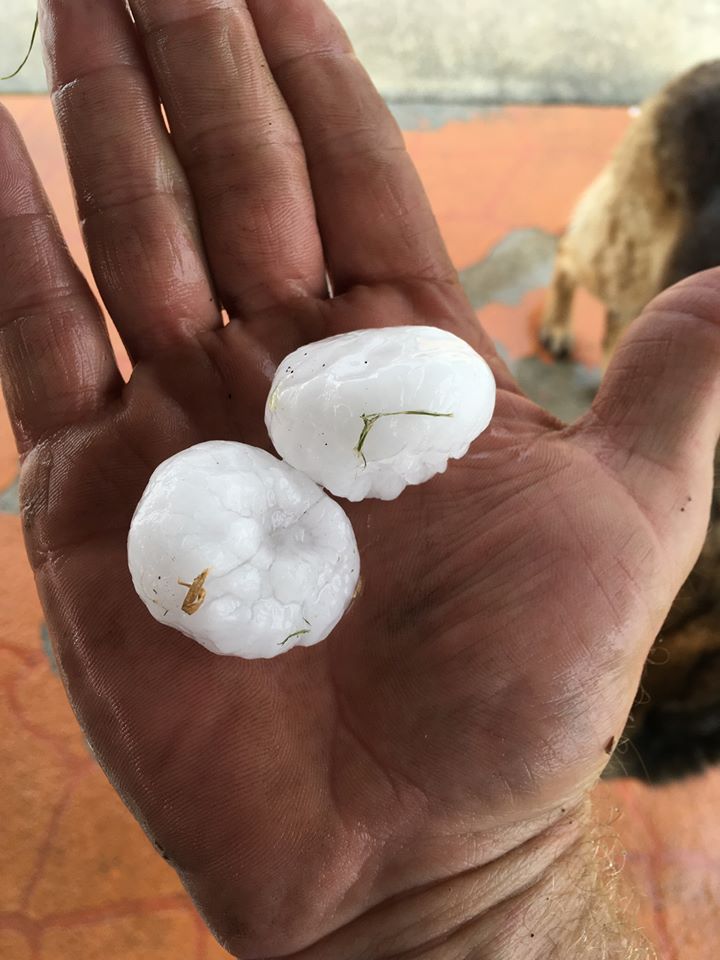
Image 1: 850 temperatures across Australia on Monday 2nd December, 2019. Source: Pivotal Weather
A volatile thunderstorm day will unfold across Victoria on Wednesday, with highly populated areas...
A thunderstorm outbreak will commence on Wednesday afternoon for eastern Queensland and NSW -...